The 3 early signals of pharma product launch success
Key takeaways:
- Three key signals are highly predictive of whether a launch is heading for success: breadth, return writing rate and depth.
- A retrospective analysis of 18 launches reveals products that achieve 30% breadth, 50% return writing rate and 30% depth by month six are nine times more likely to be successful.
- When one of these three performance signals is lagging, it serves as a guidepost to inform a targeted diagnostic of the likely driver and appropriate intervention.
Six months into launch, leaders should have enough evidence to decide whether adoption is building or whether the team needs to intervene while the trajectory can still change. Successful teams build a system to identify sub-optimal performance early, resolve barriers quickly and maintain execution velocity under real-world conditions. Benchmarks are a critical input to support confidence in early intervention.
Why pharma launch trajectory is hard to read early
The question sounds simple: Are we on a path to fulfill this asset’s potential? In practice, the answer is deceptively hard to know early enough to change course. There are two key challenges which contribute:
- Forecasts tend to be overly optimistic very early in launch before access pathways have solidified.
- It is difficult to predict the eventual uptake curve base only on limited data points for demand within the first few months following approval.
Therefore, launch teams need to dig deeper to reduce uncertainty and inform an understanding of the likely trajectory while there is still time to act. These three benchmarks – breadth, return writing rate, and depth - enable launch teams to do that as one critical and objective component of the broader launch monitoring ecosystem.
The 3 prescribing hallmarks that show whether launch trajectory is on track
1. Breadth of prescribing. Are 30% of priority targets prescribing by month six?
Breadth measures the percentage of priority target physicians who have written at least one prescription. Separation in breadth of prescribing between successful and unsuccessful launches is visible as early as month three and widens through month six.
FIGURE 1: Breadth of prescribing by launch cohort shows whether leaders need to adjust targeting, awareness or access
Note: Priority targets as defined represent what is typically the top one-third of the overall target list.

2. Return writing rate. Are 50% of monthly active writers returning by month six?
Return writing rate measures the percentage of physicians prescribing in a given month who have also prescribed in a prior month. The metric shows whether physicians who try the product come back to use it again, turning initial trial into a stable base of experienced prescribers. That base matters because return writers can help influence peers, a signal that often drives broader adoption in specialist communities.
FIGURE 2: Return writing rate by launch cohort shows whether leaders need to improve the prescriber experience

3. Depth of prescribing. Are 30% of writers reaching three or more patients by month six?
Depth measures the percentage of writers who have prescribed to at least three unique patients. Reaching a third patient signals that physicians are moving beyond initial trial and building enough experience to form a clear point of view.
FIGURE 3: Depth of prescribing by launch cohort shows whether leaders need to build confidence through education and patient identification
Note: The number of eligible patients per physician is relatively consistent across the markets analyzed. Significant deviations may require adjusting this threshold.

How prescribing hallmarks show whether adoption is becoming durable
The three hallmarks matter most when read together because they show whether adoption is moving from trial to repeat use to durable confidence. Each signal adds a different diagnostic layer:
- Breadth indicates whether enough targets have tried the product to create early momentum
- Return writing rate shows whether trial is converting into repeat prescribers, who become more likely to advocate to peers
- Depth reflects whether prescribers are building enough experience to sustain adoption and build clinical confidence
Their predictive weight also shifts over time:
- Months one to three: breadth carries the most weight
- Months four to five: return writing rate adds to breadth as a key signal
- Months five to six: depth adds further, indicating whether adoption is becoming durable
How the 3-5-3 rule performed across 18 pharma launches
By month six, trajectory was clear enough to guide action. Launches that met all three thresholds were approximately nine times more likely to succeed than those that did not. The pattern also showed where leaders needed to look harder. Brand C was the exception. Infusion site capacity and a lack of established referral pathways among target specialists constrained early adoption despite underlying demand.
FIGURE 4: Performance against the three prescribing hallmarks shows where leaders should stay the course, diagnose constraints or intervene
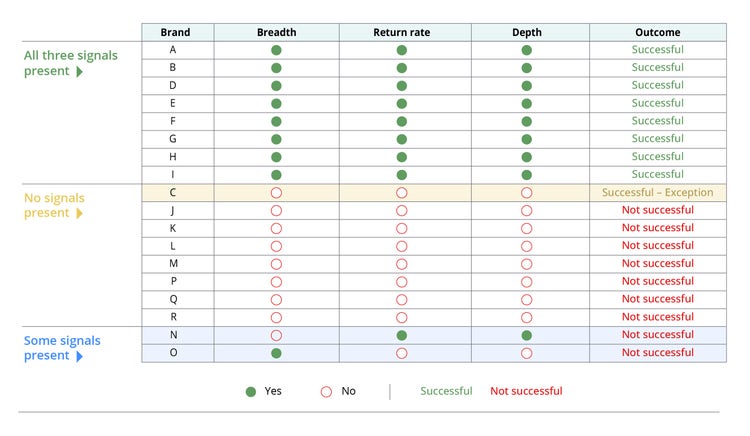
When all three hallmarks are strong, the launch has built the foundation needed to sustain growth. When one or more are weak, the gap points to where intervention is needed:
- Low breadth suggests likely barriers in awareness, access or targeting.
- Low return writing rate indicates an experience issue, whether clinical, access-related or patient support, that needs to be diagnosed.
- Low depth suggests caution in patient selection, access challenges for certain patient types or gaps in education on appropriate patient identification.
Taken together, the hallmarks do more than describe performance. They help pinpoint where the launch is breaking down and where to act while there is still time to change the trajectory. Strong launch teams use them as the entry point into a continuous diagnostic loop by monitoring KPIs, identifying opportunities in real time, using underlying intel to identify root causes and convening cross-functional teams to course-correct. Adjusting in motion is how good launch teams run a launch room. The hallmarks give that process a shared language and a concrete trigger for action.
What launch teams need to decide by month six
Benchmarks for the three early hallmarks of launch trajectory are highly predictive of launch success. Launches that meet all three thresholds are approximately nine times more likely to succeed than those that don’t. Launch teams can use these metrics and associated benchmark values to gain early alignment on trajectory and adjust course while time remains. The next move is to identify the weakest signal, diagnose the commercial, access or experience barrier behind the gap and act before the trajectory hardens.
ZS conducted a U.S. claims data analysis using Panorama Matrices to review specialty biologic launches across immunology and neurology markets. The analysis identified a focused set of metrics that consistently differentiated successful and unsuccessful launches.
ZS analyzed a range of performance and adoption metrics. When metrics were closely related or correlated, the team selected a single representative metric based on interpretability and relevance.
Launches were classified based on long-term commercial performance using two criteria:
- Performance against prelaunch year-three sales forecasts. Launches that achieved at least 120% of forecast were classified as exceeding expectations. Launches that achieved 80% or less of forecast were classified as unsuccessful.
- Performance relative to peer-group averages. Results were adjusted for market size and route of administration.
Limitations
- Sample size: The analysis includes 18 launches. Findings are directionally consistent, but the sample is not large enough to establish precise thresholds or fully control for confounding factors. These benchmarks should be viewed as guideposts.
- Analog selection: The cohort reflects specialty immunology and neurology markets across a range of competitive environments and time periods. Launches in different contexts, such as rare disease or primary care markets, may require tailored analog selection.
- Metric definitions: Breadth, return writing rate and depth are constructed using specific claims-based methodologies. Absolute values may vary with different definitions, but the separation between successful and unsuccessful launches remained consistent.
- Commercial performance focus: The analysis focuses on prescribing behavior. The analysis does not directly measure factors such as clinical differentiation, payer access, patient support or medical education, all of which influence outcomes.
- Time period effects: The launches analyzed span approximately a decade. Market dynamics, including access, payer behavior and adoption patterns, have evolved and may affect how benchmarks apply today.
Metric definitions
- Target: The top 40% of specialty writers in the market, ranked by total prescribing volume
- Priority target: The top third of targets in the market
- Breadth: The percentage of priority target physicians with at least one new patient for the product through a given month
- Return writing rate: The percentage of monthly active writers, defined as physicians with at least one new patient in a month, who prescribed the product in any prior month
- Depth: The percentage of writers who prescribed the product to at least three unique patients
- 9x likelihood estimate: The estimate is based on observed outcomes within the sample. Approximately 90% of successful launches met the threshold for each month-six hallmark, while none of the unsuccessful launches did. Because the unsuccessful-launch comparison group was 0% in this sample, the finding should be interpreted as directional evidence of strong separation between successful and unsuccessful launches, not as a precise odds ratio.
- Target physician populations: Across the cohort, target physician populations were broadly similar to those seen in many specialty markets, including psoriasis, atopic dermatitis, Crohn’s disease, multiple sclerosis and rheumatoid arthritis. Successful and unsuccessful launches drew from similar prescriber pools, which helped control for the physician universe used in the analysis and benchmark development. The number of competitors varied across markets.
zs:topic/strategy-and-transformation,zs:topic/portfolio-strategy-and-management,zs:topic/marketing,zs:topic/ai-and-analytics