Fewer covered products, billions lost: The hidden cost of the women’s health coverage gap
Key takeaways:
- New ZS research found that health plan pharmacy benefit coverage decision-makers were less likely to cover a women’s health product, even when they viewed it as highly compelling.
- The women’s health market access challenge isn’t just a patient access issue; it also creates material commercial risk, with noncoverage translating into billions in lost revenue and weaker incentives to invest in future innovation.
- Improving payer coverage decisions in women’s health will require stronger evidence planning, sharper value narratives and market-shaping strategies that better connect clinical value to payer priorities.
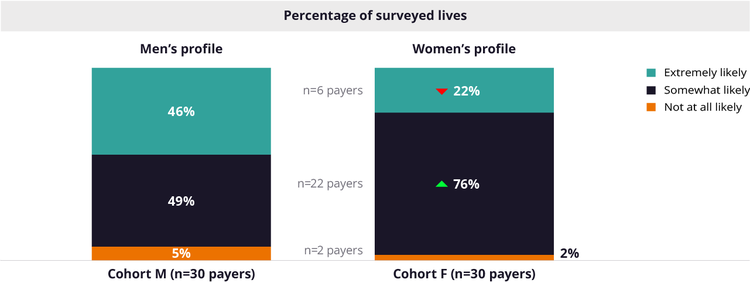
New ZS research finds that health plan pharmacy benefit coverage decision-makers were twice as likely to not cover a women’s health product, despite being more likely to rate the product as highly compelling.
The current lack of coverage of women’s health treatments translate into an estimated $4.3 billion in lost annual revenue for the U.S. pharmaceutical market, based on assets developed exclusively for conditions unique to women (excluding broader categories such as autoimmune disease, obesity or cardiometabolic conditions). Compounded over the next eight years at the category’s projected 5%-6% compound annual growth rate, this represents an estimated $51 billion in foregone pharma revenue in the U.S. alone.
The cost is much more than financial; it leaves women with subpar health outcomes and is one reason that there is continued lower pharmaceutical investment in women’s health market.
How payer coverage decisions are shaping the women’s health coverage gap
For life sciences leaders, the health benefits coverage gap between products for people of all genders is difficult to ignore. When women’s health products consistently face higher access and reimbursement hurdles, those signals shape how risk, return and scalability are assessed, often reinforcing more conservative investment decisions and narrower evidence development strategies.
Recent product launches illustrate what this looks like commercially—and what drives it. Three cases reflect the same underlying pattern: products with established clinical need that remained noncovered pharmaceutical products.
- Astellas’s Veozah (fezolinetant) for vasomotor symptoms represents perhaps the starkest example. Despite peak sales estimates of $2-$3.5B+, actual revenues are tracking between $220-$330 million for fiscal years 2025 and 2026. Vasomotor symptoms affect approximately 75% of menopausal women; the condition is chronic and significantly impairs quality of life and workforce participation.
- Sprout’s Addyi and Cosette’s Vyleesi for female sexual dysfunction both dramatically underperformed expectations. Addyi achieved formulary coverage at fewer than 25% of commercial plans after five years of availability, a stark contrast to sildenafil (Viagra), which reached approximately 90% formulary coverage within two years of launch. The products address conditions with comparable clinical burden; the coverage outcomes aren’t comparable.
New ZS research on women’s health payer strategy and coverage decisions
ZS’s Women’s Health Expertise Hub conducted a controlled study with 60 U.S. pharmacy benefit coverage decision-makers at payer organizations, presenting identical simulated product profiles that differentiated only by gender indication. Similar to classic resume studies, where identical resumes labeled “Jennifer” or “John” produce different outcomes, decision-makers evaluated the simulated product information and indicated their perceptions of value and likelihood to cover.
There was a difference between perception and potential reality. The decision-makers acknowledged the drivers of health disparity—but they didn’t believe that these drivers broadly influenced coverage decisions. And if they did, it was at someone else’s organization and not theirs.
The perception-reality gap raises an uncomfortable question: Are there inherent biases in the way women’s treatments are covered? And because of this bias, is there potential for the life sciences industry to underinvest in women’s health because of the possibility of poor returns on investment?
The results were striking. The study found that there was a bias in how decision-makers at payer organizations evaluate and made coverage decisions for a simulated, comparable women’s product versus a men’s product—and the decision-makers didn’t appear to recognize the bias.
Interestingly, these payer decision-making study participants were nearly two times more likely to perceive the women’s health product to be highly compelling. But when it came to making decisions about actual coverage, they were twice as likely not to cover the women’s health product.
FIGURE 1: How decision-makers evaluate women’s and men’s products differently
Why women’s health product reimbursement and coverage face a higher bar
How medical necessity standards may differ in women’s health
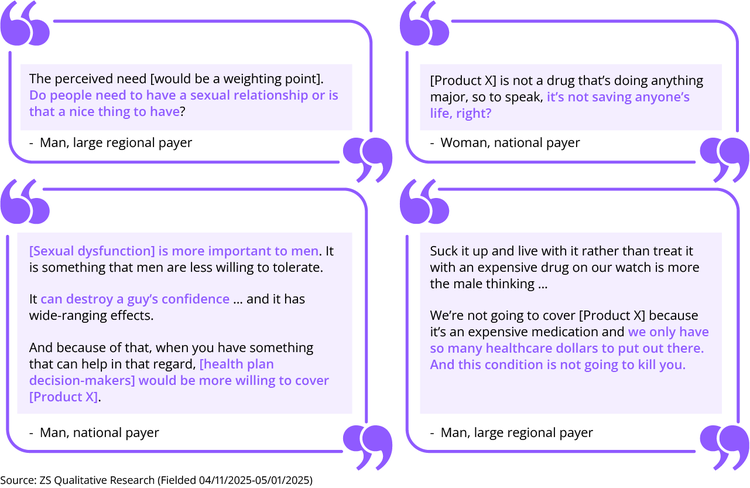
In our conversations with decision-makers at payer organizations, we noticed that women’s health innovations may potentially be inadvertently held to a higher standard of medical necessity before being deemed valuable enough to cover.
This suggests a surprising conclusion shaping women’s health coverage decisions: Women’s health benefit coverage decision may not be just about the lack of data or an economic rationale, but instead are subject to a system influenced by gendered assumptions and institutional inertia.
For example, the data from our research illustrates a double standard in how treatments for women’s health conditions are evaluated for medical necessity. People may see a sexual health product as a “nice to have” for women but see the product as the solution for a serious problem for men. At the same time, women’s symptoms are seen as less serious or subjective. A symptom like pain, for instance, could be falsely compared to a life-threatening disease and deprioritized as a result. “Women don’t die from hot flashes,” said one woman who participated in the interviews.
FIGURE 2: The double standard for women’s products
How relatability influences women’s health payer coverage decisions
Decision-makers appear to be motivated by what they understand and see as personally beneficial. People are more engaged when they perceive a direct benefit to themselves. In our conversations, decision-makers were clear that men struggle to understand women’s health needs. As a result, they make assumptions about women’s experiences that may not be reflective of the lived experience of women.
How women’s health market access barriers shape innovation and investment
These results are worth examining because we can’t change these types of biases until we understand why they exist. The healthcare landscape is incredibly complex, and this complexity allows biases to exist, often unintentionally, in the system. Coverage decisions are rarely made by individuals alone, and those making the decisions are only human, operating within the constraints and dynamics or cultures of their organizations.
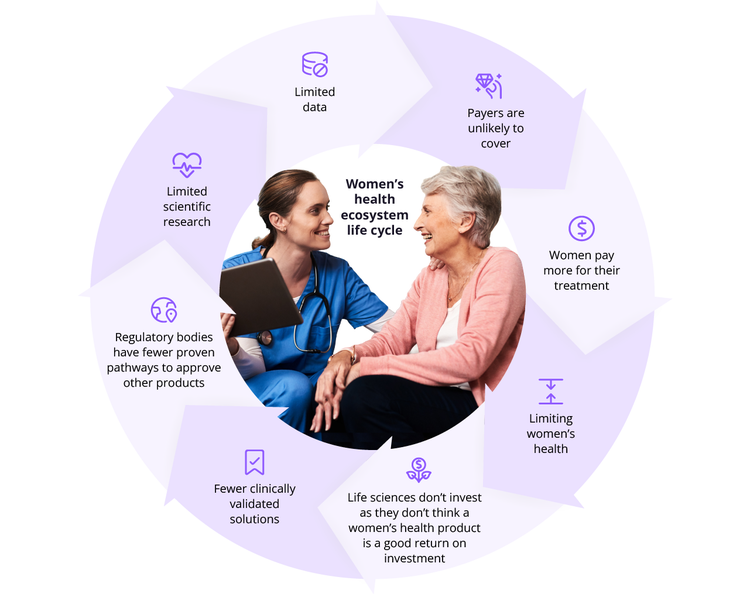
Despite growing attention and capital inflows, women’s health has long been framed as a social or philanthropic concern—contributing to persistent hesitation among some leaders who struggle to assess it through a traditional investment lens. Limited coverage is only one aspect of a larger, dysfunctional ecosystem. When women’s health assets face structurally higher access barriers, those signals cascade upstream—discouraging investment, distorting value calculation and resulting in fewer and weaker products for women.
FIGURE 3: Illustrative hidden costs and adverse consequences of a dysfunctional women’s health solution life cycle
Women with undertreated reproductive and gynecologic conditions are among the highest utilizers of emergency, specialist and inpatient care in the commercial population. Coverage for effective treatments isn’t an added cost. It’s cost migration toward a more efficient use of dollars already in the system.
There is more hidden cost in what happens before a patient even reaches an appropriate treatment for their episode of care—and these costs are substantial. Women with uterine fibroids generate $4.1-$9.4 billion in total annual direct costs in the U.S. Menopause-related productivity losses alone are estimated at $1.8 billion annually.
This research signals a structural access risk for women’s health assets. For life sciences, this can suppress uptake, distort value perception and ultimately influence long-term investment decisions. If women’s health assets face structurally higher coverage barriers, then traditional launch playbooks will underperform and investment decisions may systematically undervalue the category. For payers, this reframes the conversation as one where the product should be evaluated in the context of the total cost of the episode of care.
We believe that understanding and addressing the root causes of these health benefit noncoverage decisions will help life sciences and payers work toward better access and reimbursement for women. It will also encourage investment in the future.
How pharma can strengthen women’s health payer strategy and market access
To protect revenue and portfolios, and minimize launch risk—and ensure women get the products they need—we believe it’s important for life sciences organizations to:
- Tell a new value story: Most manufacturers approach payer conversations with a familiar structure: establish clinical unmet need, present the data and explain why they should cover it. This is table stakes, and in women’s health, it’s not enough. Checking those boxes in a market shaped by decades of underrecognition doesn’t overcome structural bias; it reproduces the conversation that has already failed patients. A compelling value story for a women’s health asset must do something different: it must make the decision-maker identify with the problem before it presents the solution. This directly addresses the “relatability deficit” our research identified: decision-makers who can’t connect personally to a condition tend to undervalue it, regardless of clinical merit. Framing women’s health innovations as solutions to systemic inefficiencies, not niche products, can shift reimbursement conversations from skepticism to strategic investment.
- Design the evidence from the start: Women’s health products may face a higher and frequently moving evidentiary bar for determination of medical necessity. Payers scrutinize clinical endpoints, durability of effect, safety data and economic value more rigorously in this category than in comparably indicated therapies in other areas. Companies that wait until late-stage development to address this issue will find themselves retrofitting an evidence package against a standard it was never designed to meet. Building payer-relevant evidence (e.g., impact on total cost of care, productivity, maternal outcomes or downstream comorbidities) into programs can reduce access barriers at launch and signal institutional commitment to rigorous, equity-driven science.
- Focus on market shaping for different populations: Understand how market shaping must look different for a women’s health asset. Market shaping in women’s health requires reframing conditions that have historically been minimized, stigmatized or underdiagnosed as serious medical priorities with system-level cost and quality implications. This means elevating the unmet need with data, mobilizing clinical advocates, partnering with patient organizations and building broader awareness among employers and policymakers, not just clinicians. Advocacy groups for conditions like endometriosis, polycystic ovary syndrome and uterine fibroids have demonstrated real influence on both clinical guidelines and payer coverage decisions that are often open to partnership. Successful market development must normalize investment in women’s health as a driver of population health, workforce participation and long-term economic value.
What payers can do (and are doing) to mitigate bias in the system
- Take intentional steps where disparities are the most urgent: Many payers are taking deliberate steps to address disparities in women’s health, often starting where the need is most visible, measurable and urgent: maternal health.
For example, several insurers have invested heavily in maternity-focused programs aimed at improving outcomes for high-risk populations. Cigna Healthcare operates a pregnancy support pilot across select U.S. markets that provides individualized pre- and postnatal care, including risk screenings, behavioral health support and access to nutrition resources for expectant mothers facing food insecurity. These efforts are designed to improve birth outcomes while addressing known disparities among Hispanic/Latina and African American/Black women.
Similarly, Blue Cross and Blue Shield of Illinois offers a women’s and family health program with Ovia Health to combine digital engagement tools with proactive outreach, personalized education, coaching and ongoing maternity support—particularly higher-risk members.
Beyond maternity care, payers have also expanded coverage for menopause symptoms. Most commercial Medicare and Medicaid plans now provide coverage for hormone replacement therapy when clinically indicated for moderate to severe menopause symptoms, reflecting a growing recognition of menopause as a medical—and economic—issue. - Staff and sponsor training: Many payers have also invested in internal and external efforts to surface and mitigate unconscious bias, including employee and plan sponsor education and provider partnerships. Like many companies, payers also have internal diversity and inclusion initiatives and have sponsored bias training for providers aimed at reducing maternal health disparities. For example, nearly one-third of Blue Cross Blue Shield companies have partnered with March of Dimes to offer the “Awareness to Action: Dismantling Bias in Maternal and Infant Healthcare” implicit bias training to their employees and network providers.
Together, these efforts reflect a broader shift: while outcomes continue to lag in many areas of women’s health, leading payers are actively experimenting, learning and investing in programs intended to close long-standing gaps, but there’s still more work to be done. - Reassess committee structures: Health plan decision-makers at payer organizations can reassess the composition of their committee structures. In other settings, including the patient’s voice in the decision-making process has been found to be an additional strategy for ensuring a rich, diverse discussion of the clinical issues. These so-called Patient-Reported Outcomes Measures are a standard part of the Medicare Stars Quality Rating System. The member advisory councils that advise state Medicaid agencies on topics such as design of health benefits and care management are another example.
Laying the groundwork for innovation in women’s health
Our research reveals a paradox that many women have already felt. Women’s health therapies can be valuable to patients, but that doesn’t mean women will have access.
That disconnect should prompt reflection across the healthcare ecosystem. If identical product profiles produce different coverage outcomes based solely on gender indication, it suggests the system is not operating as objectively as many assume and hope it is, and standard launch playbooks or methods used to evaluate new products won’t work.
The commercial opportunity is real: $51 billion in foregone revenue over eight years, across a category growing at 5%-6% annually, in the largest segment of the healthcare-consuming population.
The opportunity now is to redesign how women’s health value is translated into coverage: published evidence of efficacy that supports payer coverage requirements, narratives that create relatability and partnerships that shift norms upstream. That’s how “compelling” finally becomes “covered.”
Methodology of the ZS study
This quantitative and qualitative research was conducted by the ZS Women’s Health Expertise Hub, which partners with clients to advance solutions specifically for women and gender-expansive individuals.
The 15-minute online survey was fielded in August and September 2024, and the 60-minute qualitative interviews took place in April and May 2025. We surveyed 60 health plan decision-makers at U.S. insurance companies and interviewed 13 people who had previously completed the survey. The respondents were pharmacy and medical directors at payer organizations or integrated payer-provider networks. All respondents are voting members of their organization’s pharmacy and therapeutics committee, with 96% having final decision-making authority or significant influence in evaluating new products for health plans.
The two cohorts seeing the two products were balanced using market research best practices, ensuring consistent demographics (e.g., gender, geographical location) and scope of role (i.e., regional/national payer mix, larger regionals [500k+ lives] versus smaller regionals [250k-500k lives] and number of lives covered). Statistical testing was conducted at a 90% confidence interval.
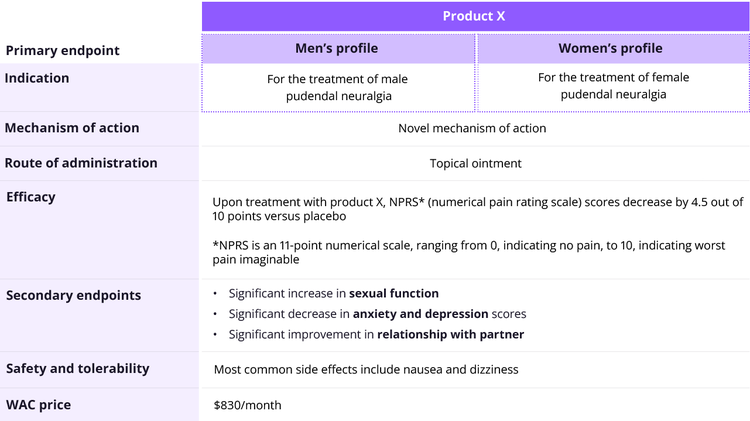
The hypothetical product profile tested was called “Product X.” The only difference in the profile across the two cohorts was the top line. One cohort of 30 health plan decision-makers at payer organizations saw “male” in the indication, and the other cohort of 30 saw “female” in the indication.
FIGURE 4: The stimuli shown to respondents
Key research questions included:
- To what extent do decision-makers at payer organizations consider or assess therapies for women’s health differently than therapies for men’s health?
- Do payer decision-makers perceive the value of women’s health therapies differently than ones for men’s health?
- Are payer biases about women’s health therapies reflected in tangible differences in coverage outcomes?
Related insights
zs:topic/customer-experience,zs:topic/strategy-and-transformation,zs:topic/value-and-access