What 69 U.S. products reveal about first-launch performance over time
Diksha Jain and Tanya Sinha were coauthors on this article.
Key takeaways
- Launch-year performance offers an early signal, but it does not reliably predict long-term success. In this analysis, the share of products missing original analyst expectations rose from 40% in the launch year (LY) to 65% by two years after launch (LY+2).
- Analyst forecasts often reset after the first year on the market. LY+1 forecasts were revised downward by about 40% for 40 products and upward by about 104% for 22 products.
- Therapy area influences both early performance and durability. Oncology and rare disease launches showed stronger early alignment with expectations, while CNS, dermatology and systemic anti-infectives showed more persistent underperformance.
- Differentiation appears to matter most when it reflects a meaningful clinical or market advantage. First-in-indication and first-in-class products generally outperformed followers, whose underperformance rose to 80% by LY+2.
A company’s first product launch is more than a scientific and regulatory milestone. It is a critical test of a company’s ability to translate innovation and clinical development into commercial success.
Our analysis of 69 U.S. first launches (2018-2024) reveals that early launch performance is highly volatile, with a clear tendency toward expectation resets and performance erosion over time. While some products demonstrate strong initial uptake, only a limited share sustains this momentum beyond the first year, underscoring that launch success is not binary or static.
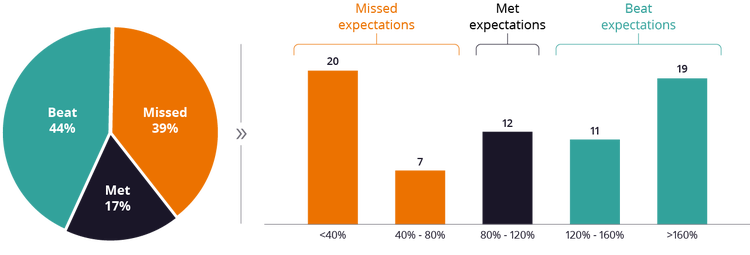
We benchmarked actual performance against analyst expectations across LY, LY+1 and LY+2, classifying outcomes as missed (<80%), met (80%-120%) or beat (>120%). Our analysis points to a central insight: Launch-year outcomes provide an incomplete and often misleading signal of long-term performance. Instead, performance is ultimately shaped by evolving market realities, therapeutic context and the degree of innovation.
FIGURE 1: Launch-year performance vs. analyst expectations (%)
Launch-year performance varies widely, and early trajectories diverge quickly
When performance is assessed against original launch-year forecasts,a more dynamic picture emerges, with noticeable shifts toward the missed category. The proportion of products missing their original launch-year analyst expectations increased from 40% (27 assets) in the LY to 65% (44 assets) by LY+2. While early success is somewhat predictive, only ~52% of products that meet or beat their original launch-year expectations continue to do so by year two, highlighting moderate but not guaranteed persistence. Among the 27 products that missed their original launch-year expectations, ~90% (24 assets) continue to miss at LY+1 and ~85% (23 assets) still miss at LY+2 based on original analyst estimates, indicating limited recovery postlaunch. Notably, this is a reflection of forecasts that are overly optimistic in some cases or the impact of the investment and execution of the launch itself.
The met group shows the weakest durability. Of the 12 products, 75% (nine assets) moved into the missed category by LY+1 and 83% (10 assets) by LY+2 and only two assets (17%) moved into the beat category. Products that beat their original launch-year expectations are the most resilient, with 60% (18 assets) remaining in the beat category at LY+1 and 43% (13 assets) at LY+2. However, some erosion occurs, with nine of 30 (30%) moving into the missed category and seven of 30 (23%) shifting to the met category by LY+2.
FIGURE 2: Revenue expectations for the LY vs. revised expectations for 2 years postlaunch
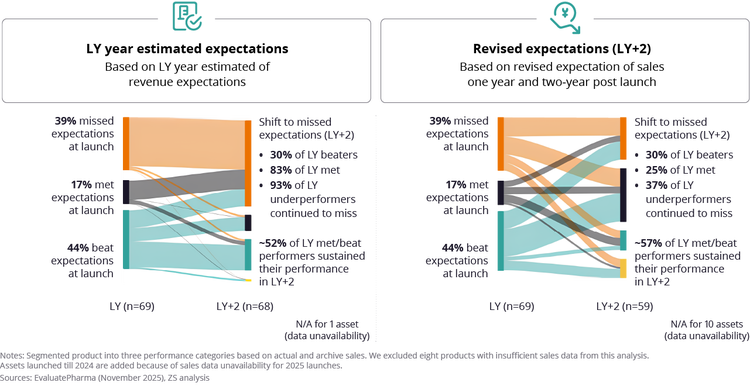
When first-launch performance is assessed against revised year-over-year analyst forecasts, the picture changes substantially. Forecast revisions show how quickly expectations reset after launch. In most cases, forecasts moved downward: LY+1 forecasts were revised down by about 40% across 40 products, most of which had missed expectations in LY. A smaller group saw forecasts move upward, with LY+1 forecasts increasing by about 104% across 22 products, nearly all of which had beat expectations in LY.
Of the 27 products that missed their original launch-year expectations, 63% (17) also missed revised analyst expectations at LY+1. This compares with 90% that have been classified as missing expectations when assessed against the original launch-year forecasts. The rest improved, with 19% moving into the met category and 19% moving into the beat category. By LY+2, only 37% (10 products) still missed against revised expectations, compared with 93% under the original launch-year forecasts.
Of the 12 products that met launch-year expectations, 50% (6) moved into the missed category at LY+1, while 33% (4) continued to meet expectations and 17% (2) outperformed. Among the 50% (6) that underperformed at LY+1, only 17% (1) missed expectations at LY+2, while 50% (3) recovered to meet expectations and 33% (2) exceeded expectations. By LY+2, only 25% (3) of products missed expectations, while 33% (4) met expectations, 25% (3) exceeded expectations and 17% (2) were classified as other or excluded.
The beat cohort showed the opposite trend under revised forecasts. Of the 30 products that exceeded their original launch-year expectations, only 27% (8) exceeded revised analyst expectations at LY+1 and just 7% (2) beat expectations through LY+2, compared to 43% under the original launch-year forecasts. Instead, most shifted to lower performance categories, with 47% (14) meeting expectations and 30% (9) missing expectations by LY+2.
First-launch performance trajectories differ significantly by therapy area
Performance patterns vary meaningfully by therapy area, with clear differences in both early traction and how outcomes evolve over time. Oncology (including rare oncology) and non-oncology rare disease launches (~70% of total drugs scanned) show stronger initial alignment with expectations, with a higher share of products beating expectations at launch. However, this early advantage moderates over time, as a portion of these products shift into lower performance categories by LY+1 and LY+2, relative to their original launch-year expectations.
FIGURE 3: Launch-time analyst expectations for performance through LY+2, by therapy area
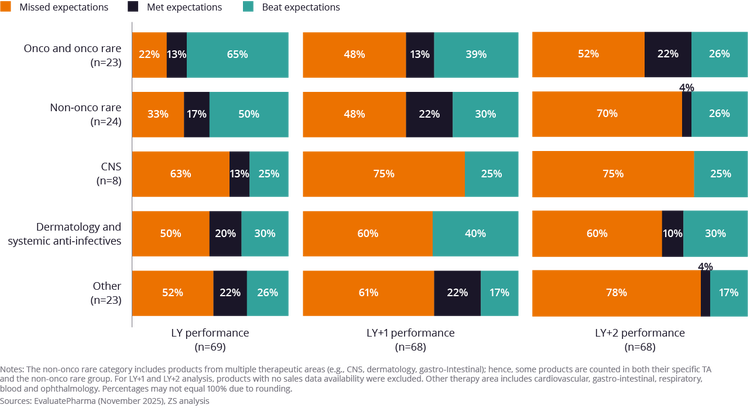
Results for CNS (n=8) and dermatology and systemic anti-infectives (n=10) should be interpreted directionally due to limited sample sizes. These other therapy areas face greater challenges from the outset. CNS products show consistently weaker performance, with most launches falling short of expectations across the first two years. Similarly, dermatology and systemic anti-infectives demonstrate persistent missed performance, with most products missing expectations at launch and continuing to do so in subsequent periods.
This pattern is also reflected more broadly when comparing rare and non-rare therapies. Rare disease products tend to show stronger early performance relative to non-rare therapies at launch, but this gap narrows over time as both groups experience a shift toward lower performance categories. In LY+2, the gap between the two groups becomes less pronounced, with approximately 65% of rare and 63% of non-rare products falling within the met or beat categories. Higher early performance may reflect concentrated patient populations, greater unmet need, specialized provider networks and manufacturer investments that help address barriers, such as patient identification, access and reimbursement.
Novel and differentiated therapies are more likely to outperform
Novelty can play a defining role in commercial performance when products improve upon the standard of care and address relevant unmet needs. To analyze how different types of innovation relate to launch outcomes, we categorized products into three archetypes based solely on their level of differentiation. Assets are categorized as first-in-indication (first to receive approval within an indication), first-in-class (introducing a novel mechanism of action or modality) or followers (entering established indications with existing mechanisms and therefore competing in more mature therapeutic spaces).
FIGURE 4: Launch-time analyst expectations for performance through LY+2, by novelty
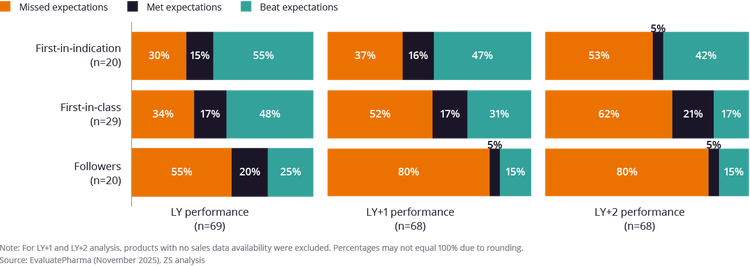
First-in-indication products have the strongest outlook, with nearly half of products beating expectations. First-in-class products also show a strong presence in the “beat” category. Followers face the most competitive pressure from the start. More than half of followers missed their original launch-year expectations, and as projections move into LY+1 and LY+2, this number increases dramatically to 80%. Since these therapies enter crowded categories, and sometimes with limited differentiation, adoption may be slower than assumptions in original forecasts as they compete for share rather than creating new market space.
What first-launch performance means for launch preparation
Across therapy areas, novelty archetypes and performance categories, one consistent theme emerges: first-launch performance is highly dynamic during the first two years postlaunch. How much of the performance relative to expectations is driven by forecasts being optimistic or pessimistic or the launch preparation, investment and execution varies substantially and the impact of each component is difficult to definitively attribute. Taken together, the findings suggest that first-launch performance is best interpreted over time rather than through launch-year performance alone. Launch-year outcomes provide an early view, but they do not fully determine long-term performance.
While many products that meet or exceed expectations at launch continue to do so, a meaningful share shifts between performance categories over time relative to original launch-year expectations. Differences across therapy areas and levels of therapeutic novelty highlight clear variation in performance.
For additional perspectives on launch performance, see “Why clinically differentiated assets miss market expectations in pharma launch strategy.”